How to see places on the map, over time
Open Investigate and choose Map.
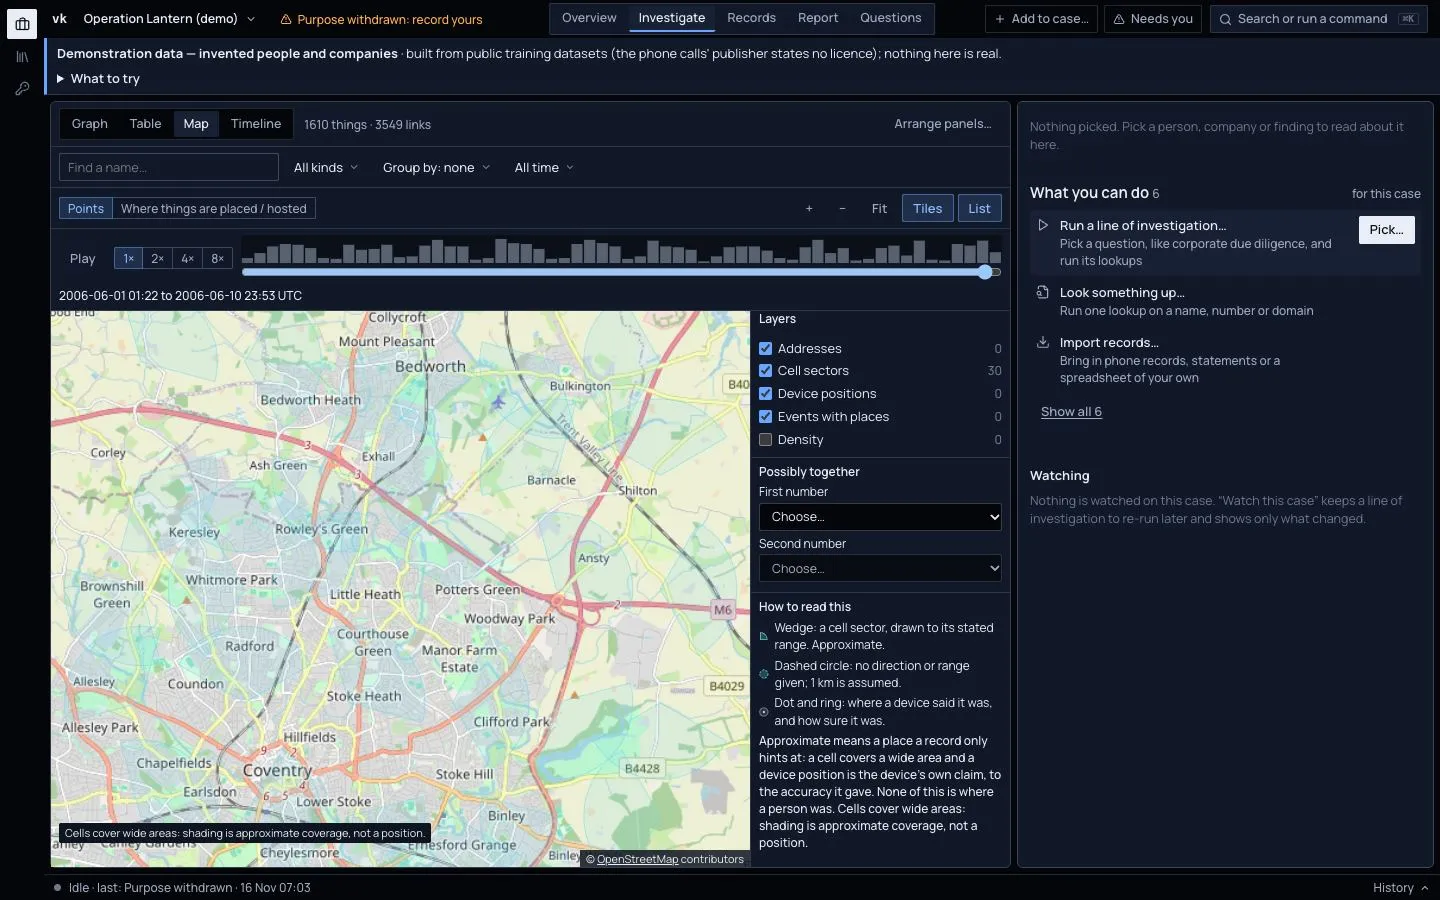
What is shown
Choose which layers to show:
- Addresses. Places of companies and people. Points that were worked out by a geocoder have a dashed rim.
- Cell sectors. Where a phone connected, drawn as an area, never a pin.
- Device positions. Positions that a device reported itself.
- Events with places.
- Density. How concentrated the points are.
Zoomed-out points are grouped and show a count. Click a point to see a small card and the thing in the dossier.
Points shows places; Where things are placed / hosted shows bubbles at country centres with counts. Click a bubble and the Table opens, filtered to that country. List shows the same places as a list.
Possibly together takes two numbers and shows where both were in the same area at about the same time.
The map tiles come from OpenStreetMap, over the internet. Press Tiles to turn them off for a plain grid. Nothing is then fetched.
Add time
The time strip sits above the map when the case has dated places. Its bars show how much happened when, and the range it covers is printed under it (here 1 to 10 June 2006, UTC).
- Drag the slider to choose a period. Only what was in that period is shown.
- Press Play to run through the range at 1×, 2×, 4× or 8×. The map changes as it goes.
- Press it again to stop, and drag to a moment.
This shows where a phone was said to be across a night, or when a company moved.
The period is shared. Dragging across the lanes in Investigate › Timeline sets the same range here, and the Graph and Table narrow to it too.
Be careful with cells
A cell site is a wide area. A phone in it could be anywhere across it, often several kilometres. The map shows areas for this reason. Do not read a cell as an address. See Limits.
An address that was only guessed from a name by a geocoder can be wrong. A dashed rim means a guess. The Mumbai office of a company, for example, may find no match and simply stay unplaced.