How to arrange, format and export a link chart
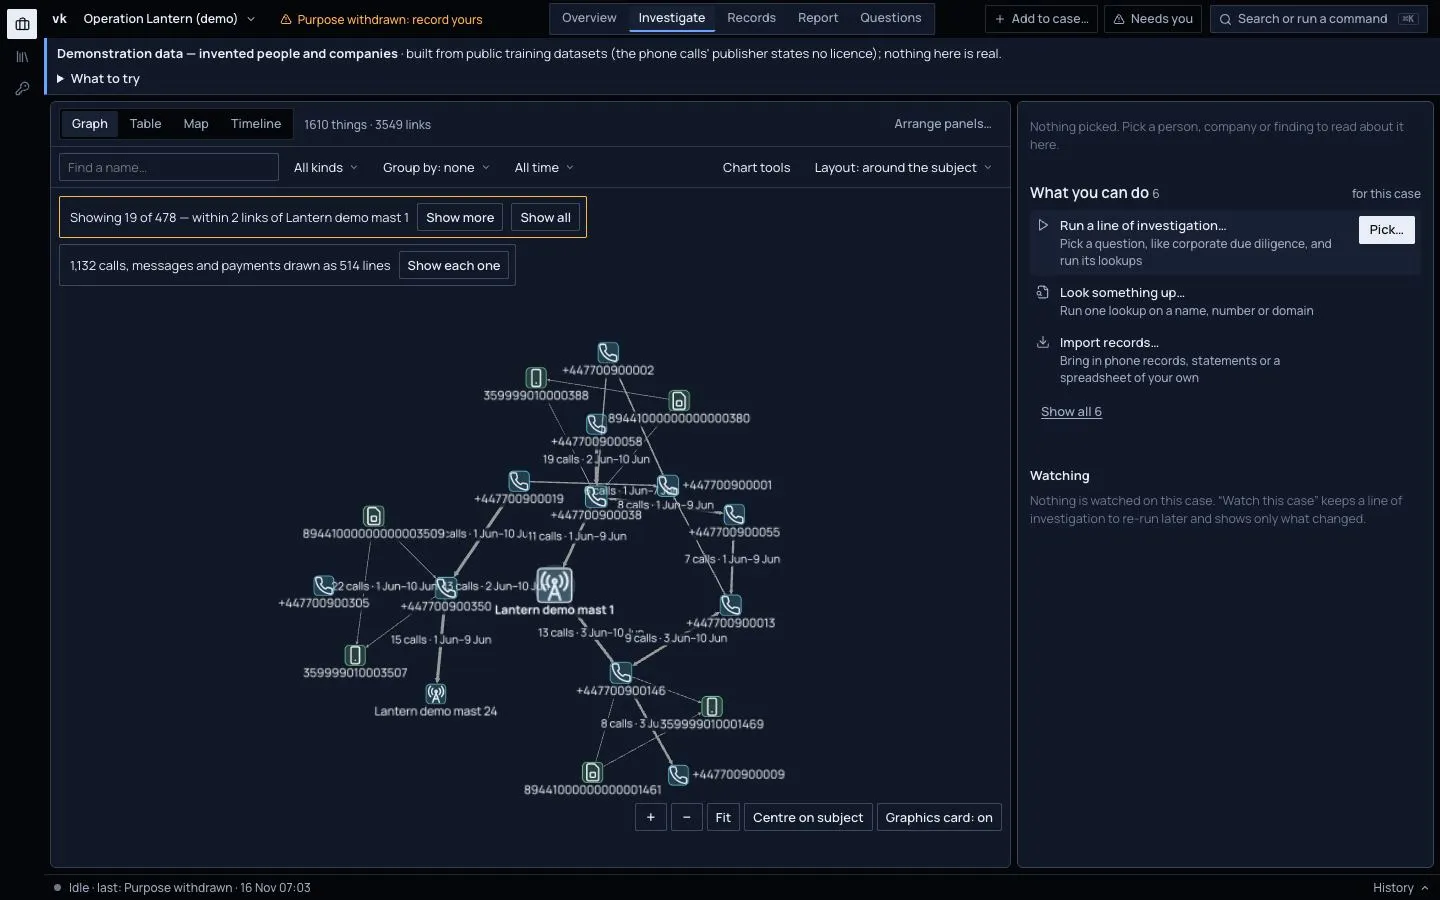
Investigate › Graph is your link chart. Things are boxes and links are lines. A thicker line means more calls, messages or links, and a green line means a strongly graded source.
Choose a layout
Pick an arrangement from Layout in the filter row above the chart.
| Layout | Use it to |
|---|---|
| Around the subject | See the subject in the middle and what surrounds it. This is the default. |
| Ownership top down | Show owners above what they own. |
| Circles by kind | Put each kind of thing in its own ring. |
| Peacock | Put one hub in the middle, its links as spokes and what hangs off each spoke fanned outward. |
| Timeline chart | Lay time out left to right, with a lane per thing. It needs dated things. |
| By kind | Group things in columns by what they are. |
You can still drag a box. Your positions stay.
Calls and payments as links
Phone and bank records hold every call and payment as its own record. Drawn one box each, a phone case fills the chart with "Call · 4 Jun 2006 19:46" boxes. So in a case with ten or more calls, messages and payments, the chart draws them as links: one line between each pair of phones or accounts, thicker for more.
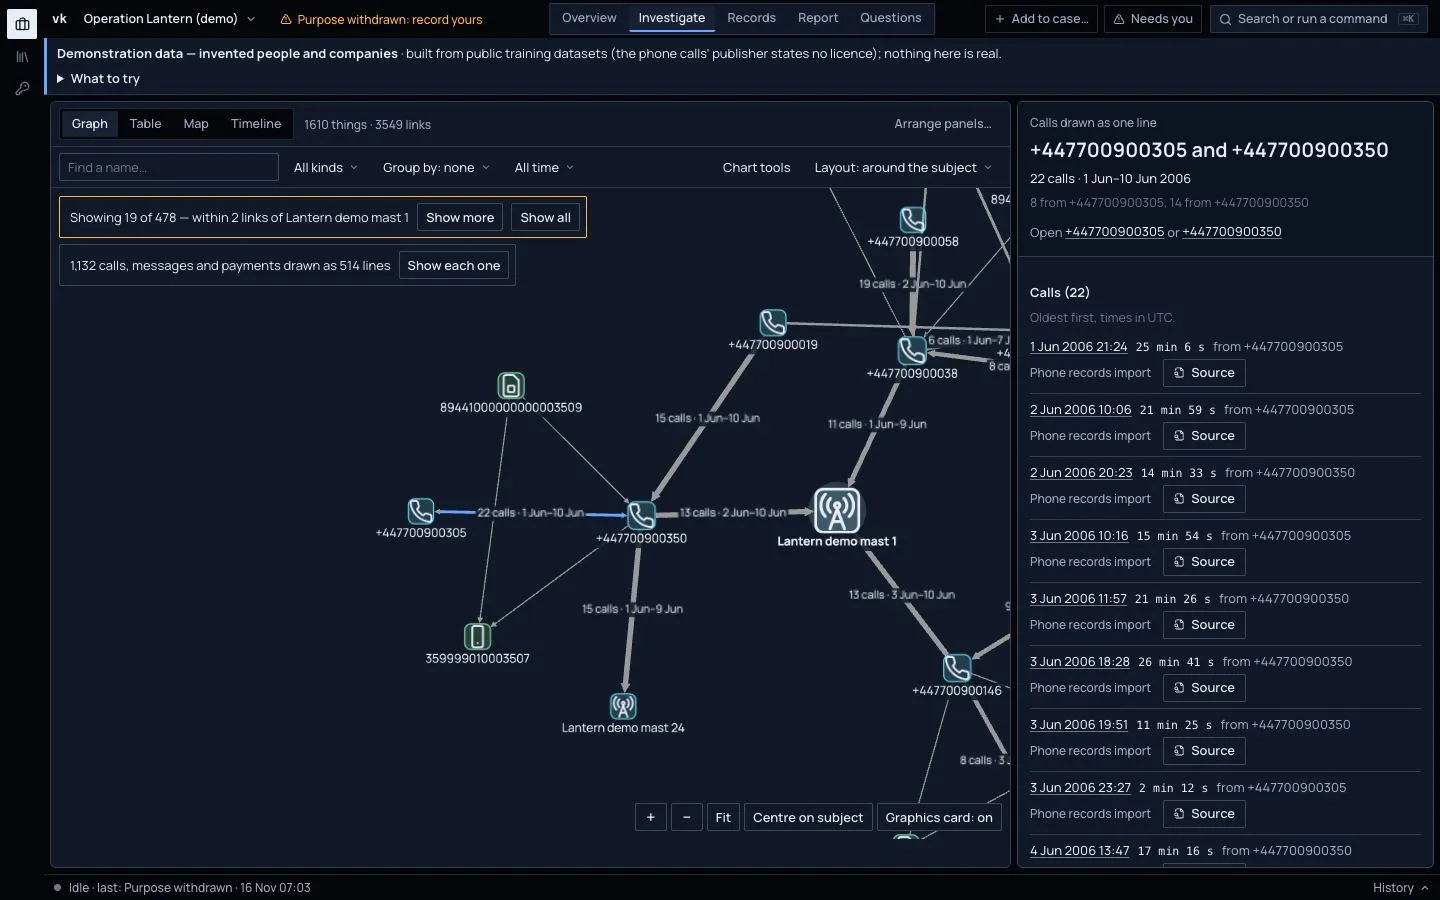
- A line between two phones reads "22 calls · 1 Jun–10 Jun". A line between two accounts reads "3 payments · £29,825", and is thicker for more money as well as more payments.
- The arrow points from the caller or payer. A line with an arrow at each end ran both ways.
- A line from a phone to a cell mast counts the calls that phone's own records place at that mast.
- A quiet bar above the chart says how many records are drawn this way, for example "1,132 calls, messages and payments drawn as 514 lines".
Click a line to read it in the dossier: who it joins, how many and when, which way, and every call or payment with its source. Click a date to open that record.
To see each record as its own box again, press Show each one in that bar, or open Chart tools and choose Calls and payments: As events. Your choice is kept.
The time range in the filter row narrows what each line counts, and hiding a kind hides its lines. A route from How is this connected to… that runs through a call lights the line the call is part of.
Group a crowded chart
Group by folds things into groups so a big case stays readable:
- Kind, such as all addresses together.
- Owner, such as addresses under the provider that owns them.
- Parent, such as names under their main domain.
- Country, where places are known.
Click a group to open it. Cases of several thousand things stay usable this way. A large case first shows only what is near the subject, with a bar such as "Showing 49 of 1610, within 2 links of …"; press Show more or Show all.
Format
Press Chart tools in the filter row. It has:
- Calls and payments. As links or as events (see above). It shows only when the case has calls, messages or payments.
- Key. What each shape and line means.
- Format rules. Switch on any of these:
- Colour by country.
- Fade older than a date you set.
- Highlight sanctioned, which rings anything on a sanctions list.
- Size by number of links.
- Notes. Add a text box puts a label on the chart. You can box a few things together with a note.
Export
The Export section of Chart tools has:
- Copy as image, to paste into a document.
- Save PNG.
- Save SVG. A sharp picture that stays crisp at any size.
What you export is what was on screen, including your notes and layout.
To export the data itself rather than a picture, see Build a report and export the case.